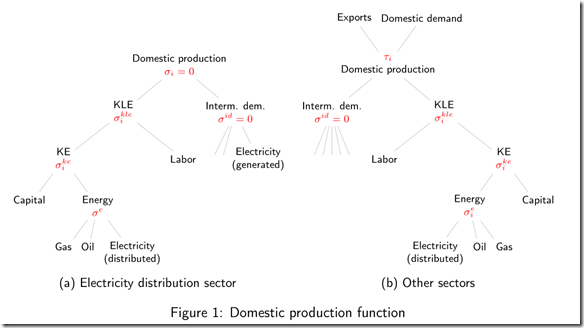
In my work I often have to describe the model I use. For this it is almost inevitable to draw some hierarchical production functions. The following shows you how to draw two production functions side by side using Tik/. TikZ is a German acronym and stands for “TikZ ist kein Zeichenprogramm” (TikZ is not a drawing program) and produces high-quality drawings in LaTeX.
This is how the two production function look in the paper:
I use the Latex package subcaption (as the package subfigure is deprecated) to get the two production functions side by side. You further need to load Tikz and Tikz-qtree.
|
1 2 3 4 5 6 7 8 9 10 11 12 13 14 15 16 17 18 19 20 21 22 23 24 25 26 27 28 29 30 31 32 33 34 35 36 37 38 39 40 41 42 43 44 45 46 47 48 49 50 51 52 53 54 55 56 57 58 59 60 61 62 63 64 65 66 67 68 69 |
\begin{figure}[!htb] \centering \begin{subfigure}[t]{0.45\textwidth} \centering \begin{tikzpicture}[scale = 0.9, every tree node/.style={fill = white, align = center} ,sibling distance=2pt ,level distance=40pt] \tikzset{edge from parent/.style={draw, color=lightgray, edge from parent path= {(\tikzparentnode) -- (\tikzchildnode)}}}] \Tree [.{Domestic production\\ $\textcolor{red}{\sigma_i=0}$} [.{KLE\\ $\textcolor{red}{\sigma^{kle}_i}$} [.{KE \\ $\textcolor{red}{\sigma^{ke}_i}$} {Capital\\} [.{Energy\\$\textcolor{red}{\sigma^e}$} {Gas\\ } {Oil\\ } {Electricity\\(distributed)} ] ] {Labor} ] [.{Interm. dem.\\$\textcolor{red}{\sigma^{id} = 0}$} {} {} {Electricity\\(generated)} ] ] \end{tikzpicture} \caption{Electricity distribution sector} \end{subfigure} \begin{subfigure}[t]{0.45\textwidth} \centering \begin{tikzpicture}[scale = 0.9, every tree node/.style = {fill = white, align = center} ,sibling distance=2pt ,level distance=40pt] \tikzset{grow'=down, edge from parent/.style = {draw, color=lightgray, edge from parent path = {(\tikzparentnode) -- (\tikzchildnode)}}} \Tree [.{\\ $\textcolor{red}{\sigma_i=0}$} [.{KLE\\ $\textcolor{red}{\sigma^{kle}_i}$} [.{KE \\ $\textcolor{red}{\sigma^{ke}_i}$} {Capital\\} [.{Energy\\ $\textcolor{red}{\sigma^e_i}$} {Gas\\} {Oil\\ } {Electricity\\(distributed)} ] ] {Labor} ] [.{Interm. dem.\\ $\textcolor{red}{\sigma^{id}=0}$} {} {} {} {} {} ] ] \tikzset{grow'=up} \Tree [.{$\textcolor{red}{\tau_i}$\\Domestic production} {Exports} {Domestic demand} ] \end{tikzpicture} \caption{Other sectors} \end{subfigure} \caption{Domestic production function} \end{figure} |
Some remarks:
- The following line starts the left panel of the figure. I set the width to 0.45 of the text width, so both pictures can fit easily. Furthermore, I use the option “t”, so that both figures align at the bottom.
1\begin{subfigure}[t]{0.45\textwidth}
- The following code starts the TikZ picture with some style settings. The size of the picture is slightly reduced
123456789\begin{tikzpicture}[scale = 0.9, every tree node/.style ={fill = white, align = center},sibling distance=2pt ,level distance=40pt]\tikzset{grow'=down,edge from parent/.style = {draw, color=lightgray,edge from parent path ={(\tikzparentnode) -- (\tikzchildnode)}}}\Tree
- The direction of growth for the production function is down. I change this direction to “up” to add the top of the picture.
- Each nest starts with a top node by adding a dot right after the square parenthesis, like: [.{your text}. Every child is added by some text between two curly brackets like

