Wow, I just discovered how easy it is to produce nice LaTeX tables from your Gams results. Usually I capture my model results in some parameters that are exported (using gdx or gdxxrw) to excel. Then I make my tables in Excel and use an excel add-in to export the table to LaTeX (I have written about this add-in in this blog). This works fine, but is tedious because as soon as my results are in excel, I can’t do things automatically and have to click my way to get my LaTeX tables.
Today, I was working on the parking model and wanted to automate my LaTeX tables. I already wrote on how to produce nice plots using R Statistics, but that might have been too geeky for a lot of you (“I don’t do network modelling and Excel or Gnuplot produces plots that will do…”). However, what I show you today is worth trying to start working with R if you are doing your modeling with Gams.
My workflow now looks like this:
- Run my model and produce some parameter with results and export the parameters to a gdx file
- Read the parameters from the gdx file with R using the R package (gdxrrw).
- Recast the data using “cast” and “mold” from the package reshape (see for an excellent introduction (http://www.jstatsoft.org/v21/i12/paper)
- Use the R package “xtable” (see http://cran.r-project.org/web/packages/xtable/xtable.pdf) to produce for each table a separate tex file.
- Write my paper and include the tex files with tables.
Let us have a look at the code for every step.
1. Run my model and produce some parameter with results and export the parameters to a gdx file
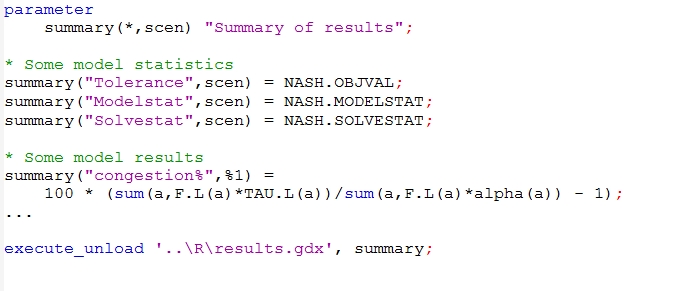
Most of this is straight forward. Note that I save my gdx files in my R directory. In this directory I have my R-scripts.
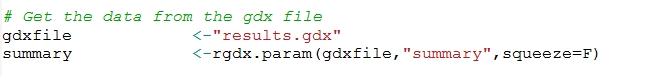
2. Read the parameters from the gdx file with R using the R package (gdxrrw).
Gams Corporation is working on a R-package that allows you to transfer data from R to Gams and the other way around. The package is called gdxrrw (the “rrw” stands for R read and write) is still work-in-progress, but you can already use it (just download it from (http://support.gams.com/doku.php?id=gdxrrw:interfacing_gams_and_r).
When you have it installed, you can use it as follows:
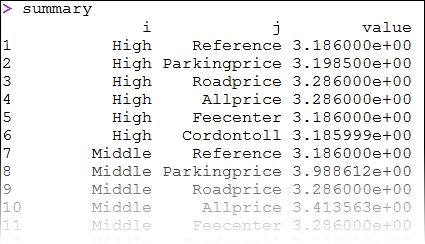
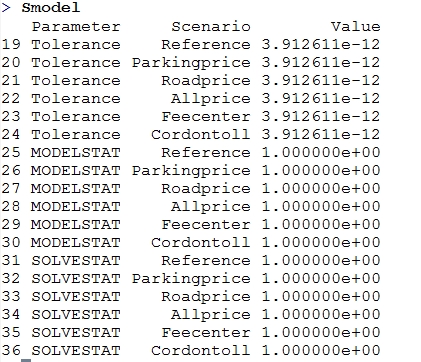
The gams parameter is now a R data frame with the following structure:
3. Recast the data using “cast” and “mold” from the package reshape
I want to produce two different tables: one for the model statistisc and one for the road results. I saved all this results in one parameter, so now I have to take a subset of the results for every table.

I defined a subset “modelstatistics” and use them to subset my dataframe using %in%. This gives us the following dataframe
I want to have a table with the parameter as columns and the scenarios as rows. For this I first rename the columns and then I use the cast command:
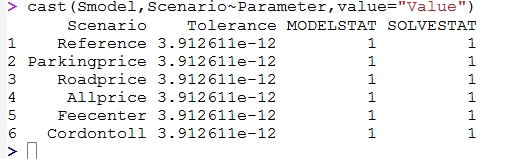
If I combine this with the xtable command, I already have my LaTeX table:

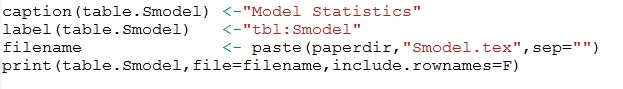
4. Use the R package “xtable” to produce for each table a separate tex file.
Now we are almost ready: I set some options for saving the LaTeX table (table title, label and filename) and save the file using the print command on the table:
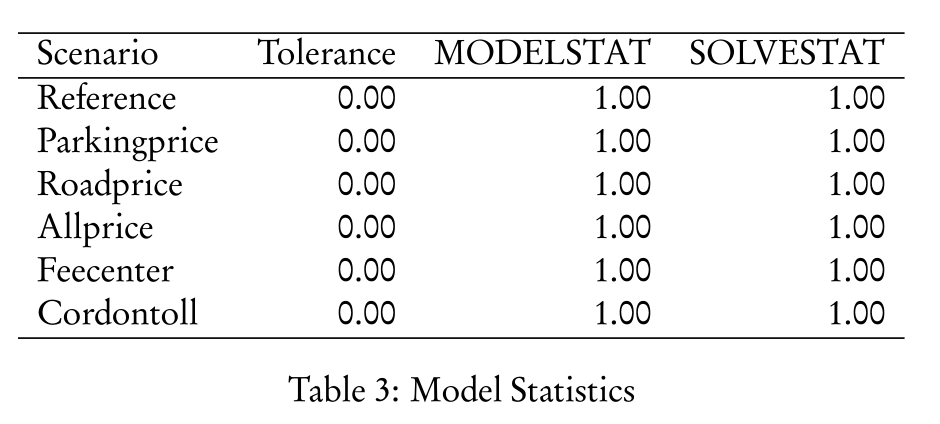
5. Write my paper and include the tex files with tables.
I jump in my paper tex file and add the following line for including the table:
and produce my LaTeX file:
In your xtable-code in the R-script you can a lot of additonal options to format your table.
The great thing is that I can do it all now without having to adjust my tables every time I run a different or addtional scenario. I just add in gams the following line to run the R-script:
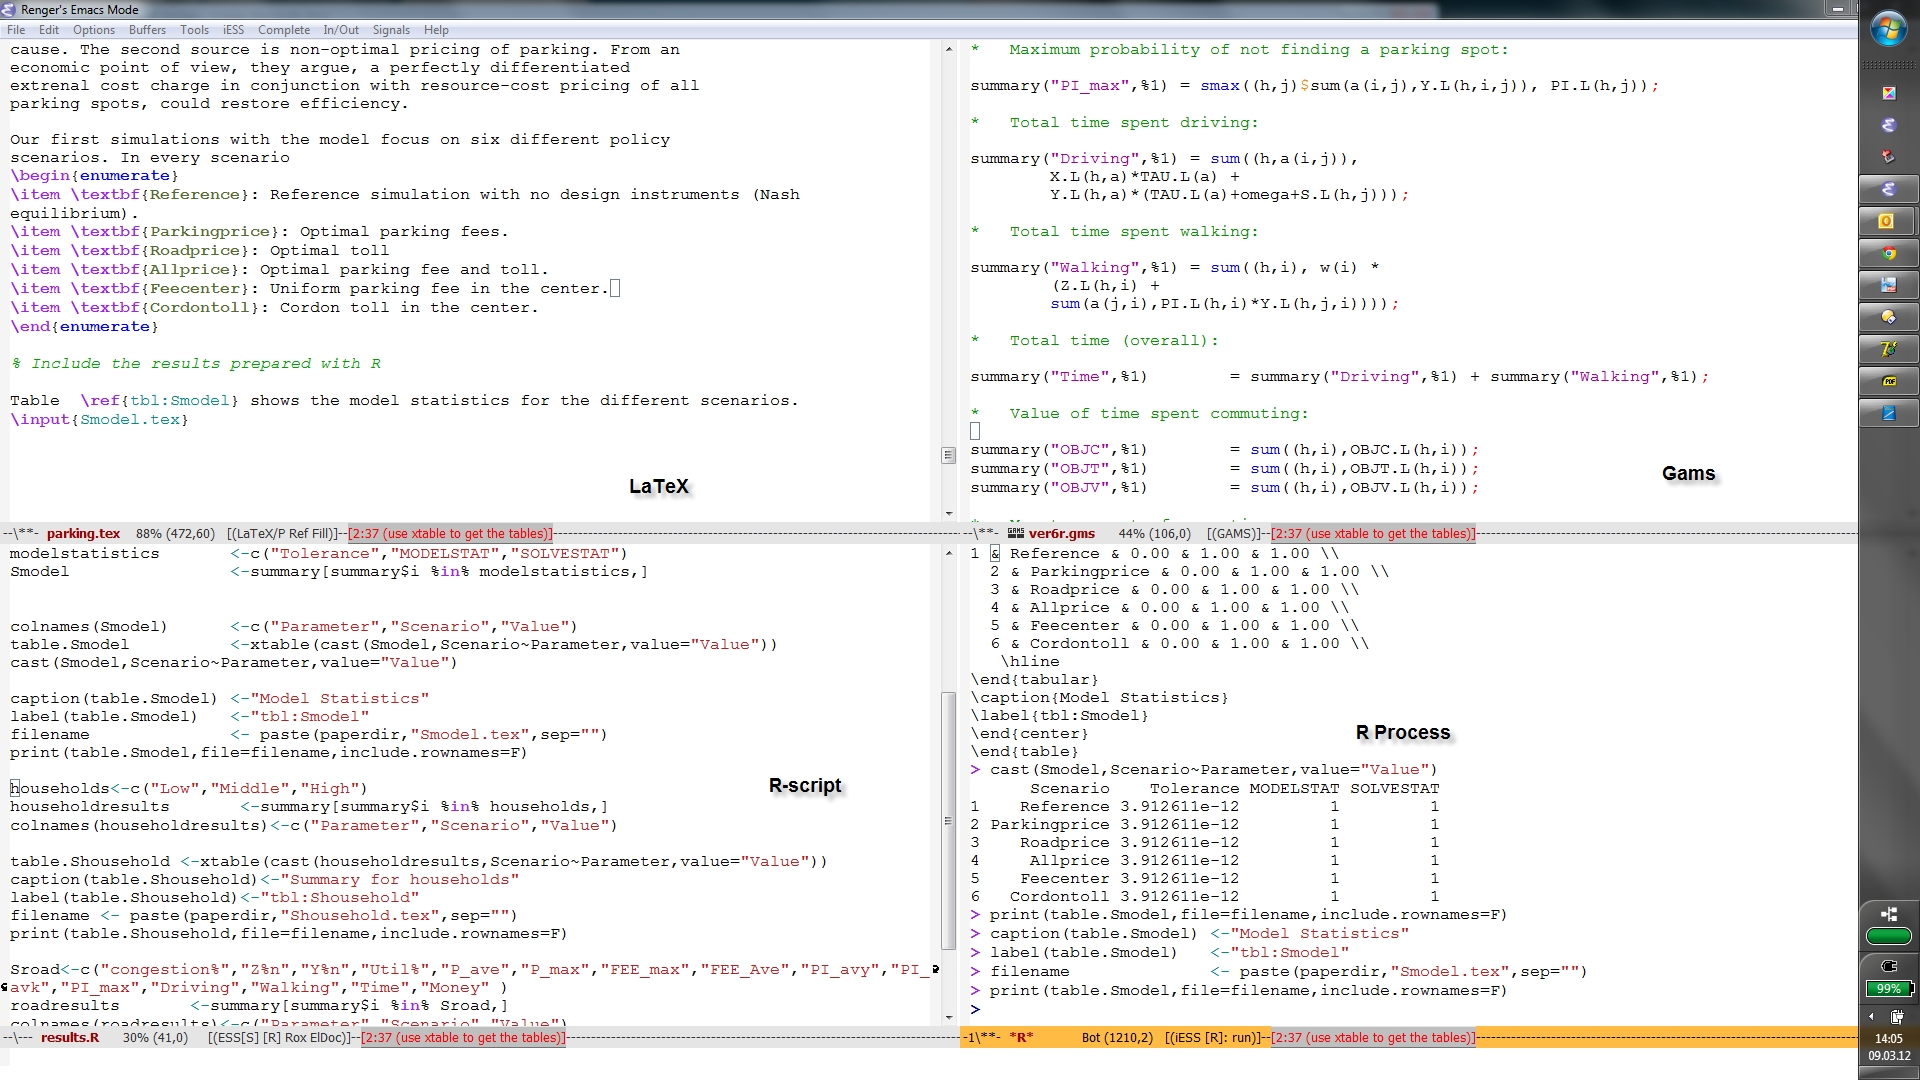
And for the Emacs fans: I didn’t have to leave Emacs at all: I run my Gams model, my R code and my LaTeX from within Emacs (and for those with the good eyes: I can even clock this task…)
In a next post, I will write more on the use of cast: you can use this R command for lots of interesting stuff (building tables with the sum, mean, min, max, etc.).
Thanks! I know Sweave (btw: Knitr is even better), but for “pure” LaTeX files, I prefer to work with LaTeX and not have the hassle of processing the Sweave files with a few R-Chunks. Furthermore, the R-Scripts I wrote, can also be used for other papers, research etc.
Very nice post, didnt know it was so easy combining R and GAMS. But you can be even more efficient by using sweave. It is a tool combining R and LaTex in one script. So nice 🙂