You also probably did not read the complete Emacs-Speaks-Statistics manual… ? By chance, I discovered a nice feature, called Rdired.
This command gives you a dired-buffer with all your objects. In this buffer you can view, edit and plot your R-objects. It is documented in chapter 12.9 of the manual.
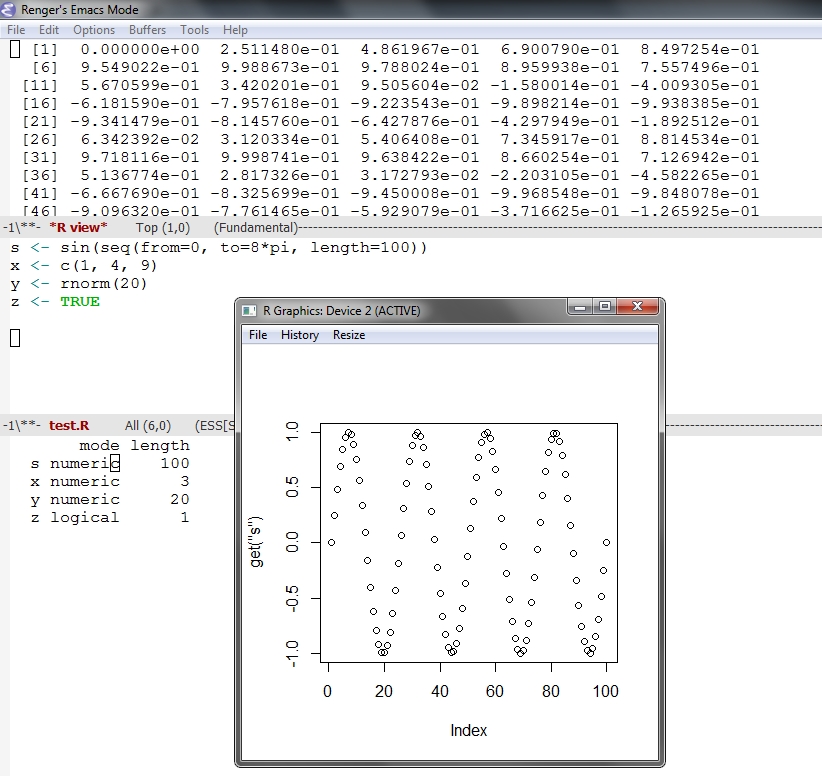
Here is small example: In the buffer in the middle, you see the original code taken from the manual. I invoked ess-rdired and the lower buffer is shown. I then put the cursor on the line with the parameter s and hit “v”. This gave me the upper buffer with all the values. Then I hit the “p” and a nice plot is shown. With “d” you could delete the object.
You have to put the following lines in your .emacs file: